1.) Distinguishing Features and their Hierarchy
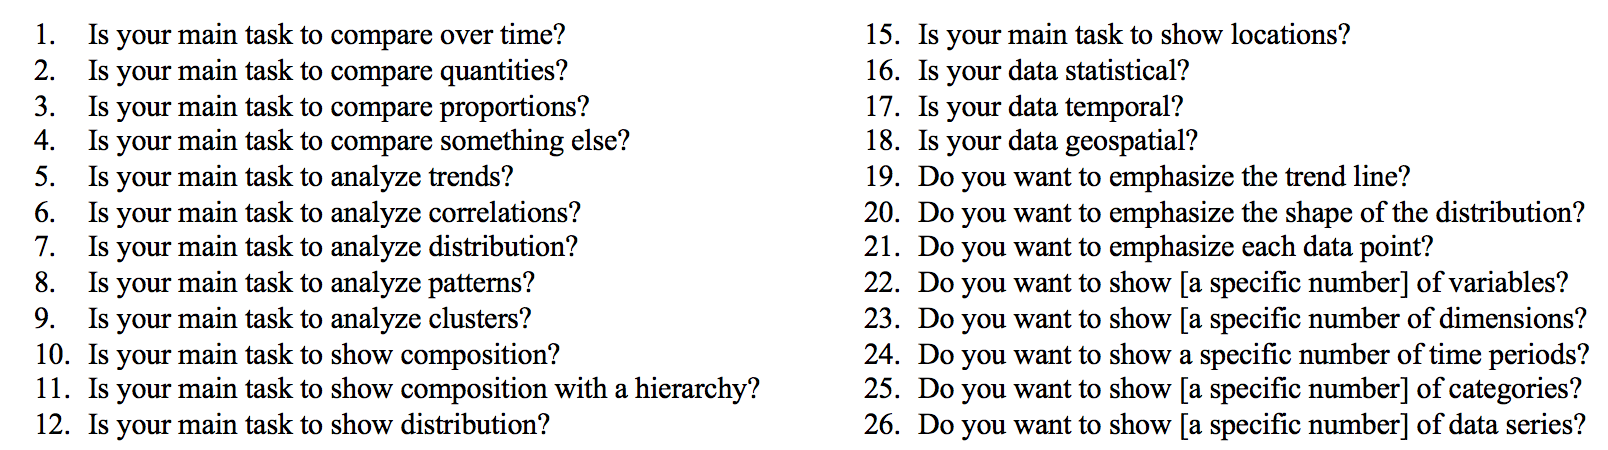
The internal nodes of our model are questions which possess the ability to clearly distinguish different types of data visualizations. The subject of such a question must be something that we define as a distinguishing feature.
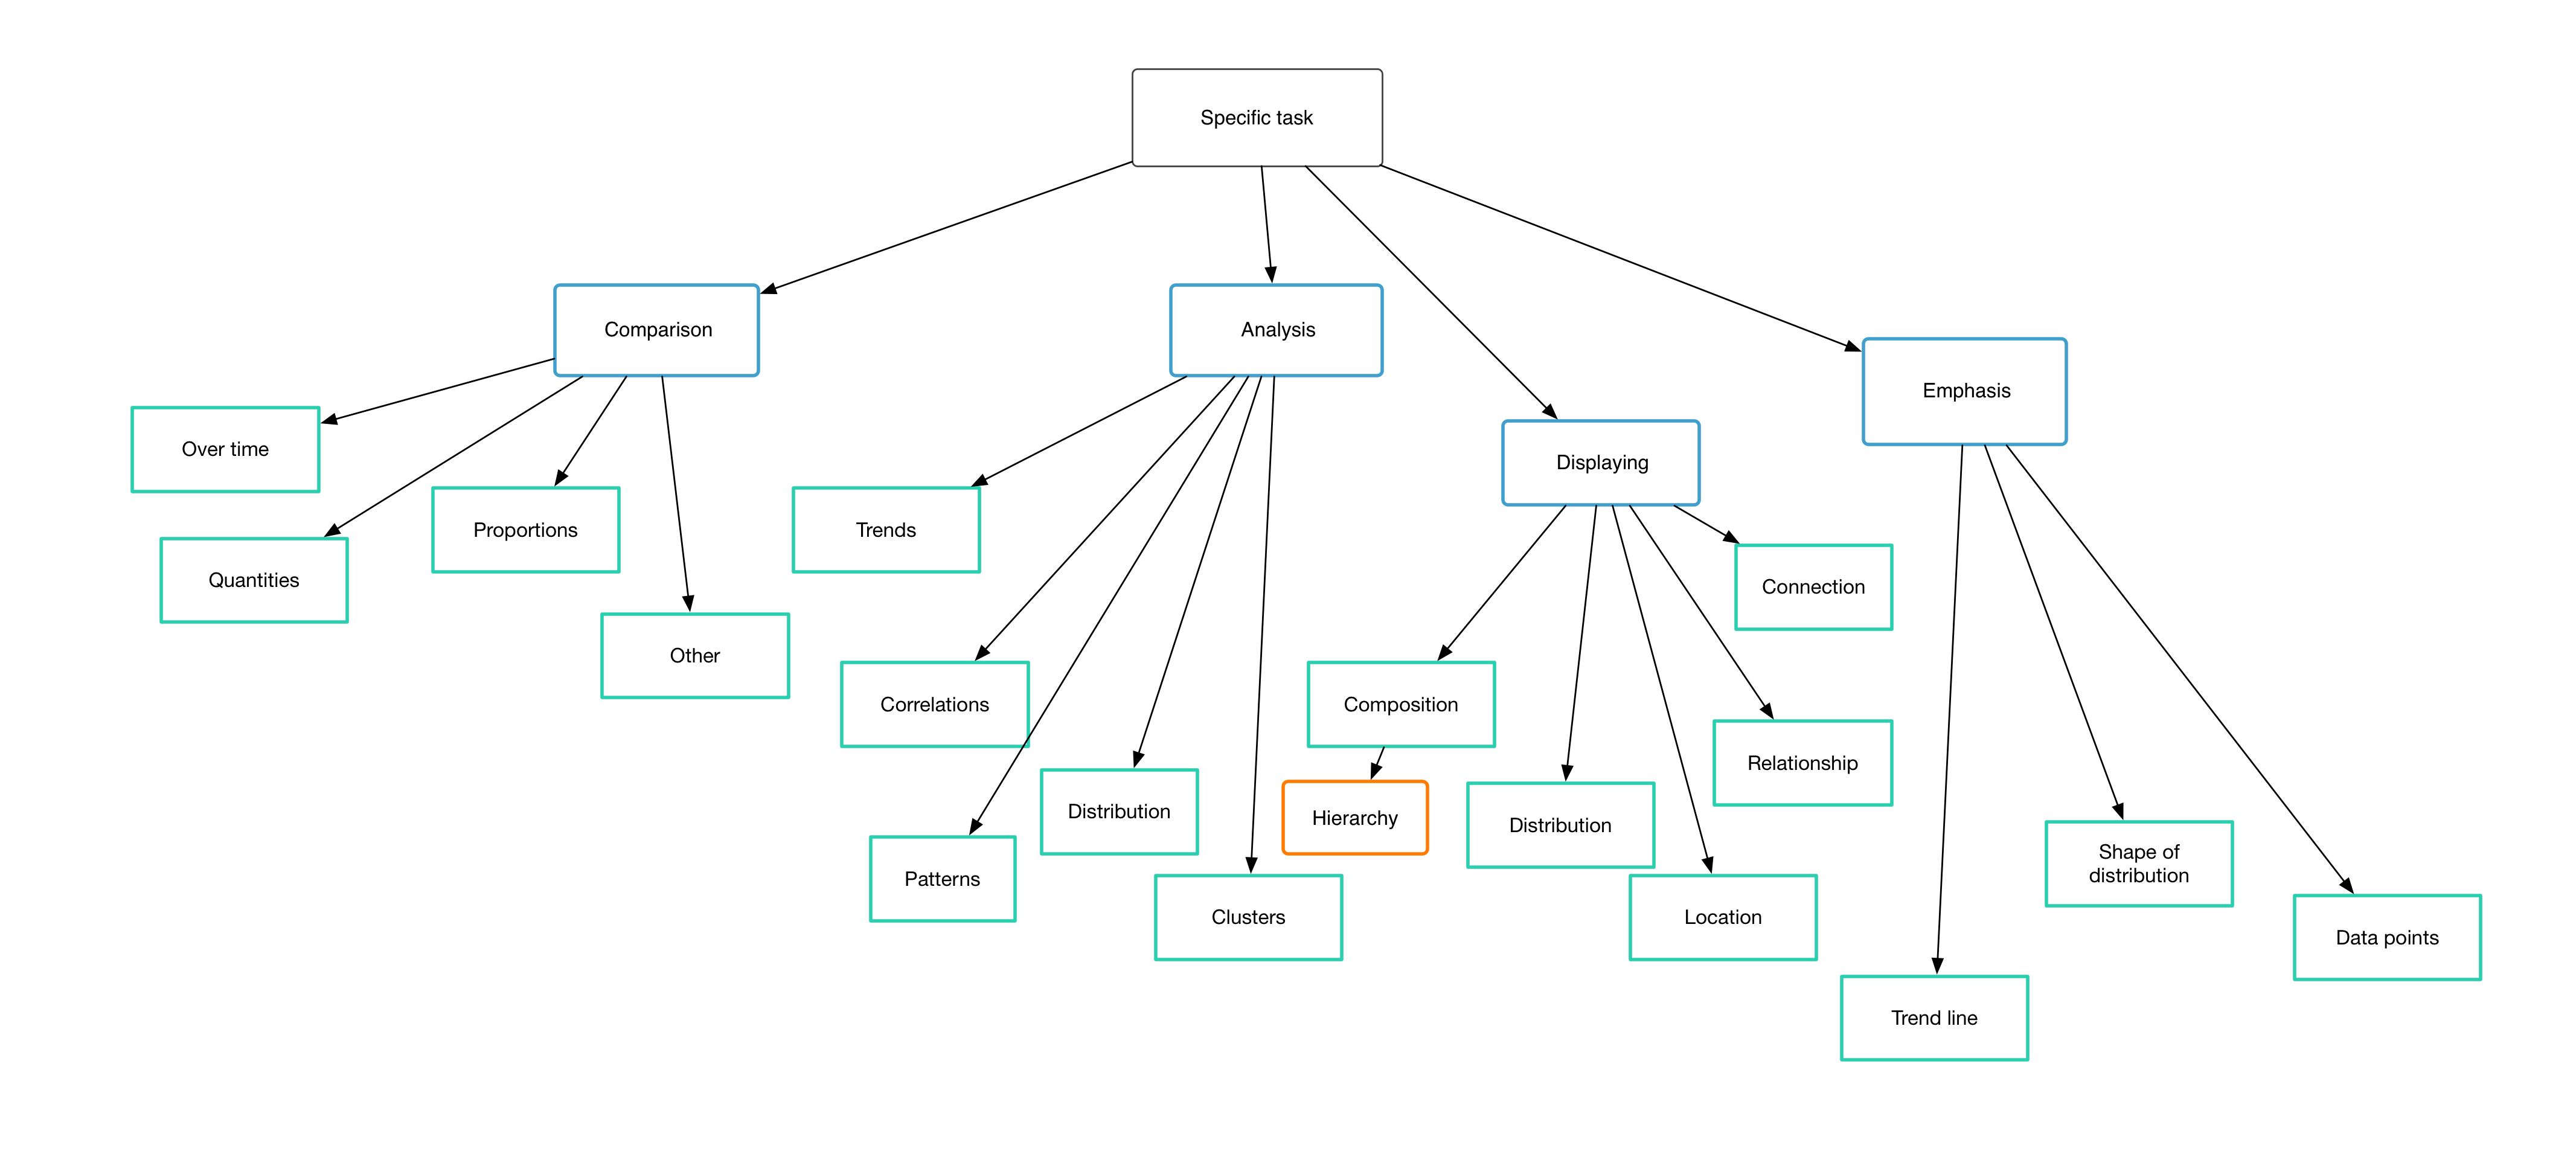
We base the questions on a clear classification hierarchy. As far as we know, there is no one specific classification hierarchy of data visualizations which would be used globally. We researched different methods of classification and combined them together to derive a classification of our own. We went through a total of 20 books and for each one, we constructed a diagram showing the classification that was described in the text.
We then combined all the diagrams into our own classification hierarchy.
Below you can see a snapshot of the classification hierarchy. You can also download the complete diagram.
2.) Questions
We have constructed questions based on our classification hierarchy.
3.) Visualization classifications
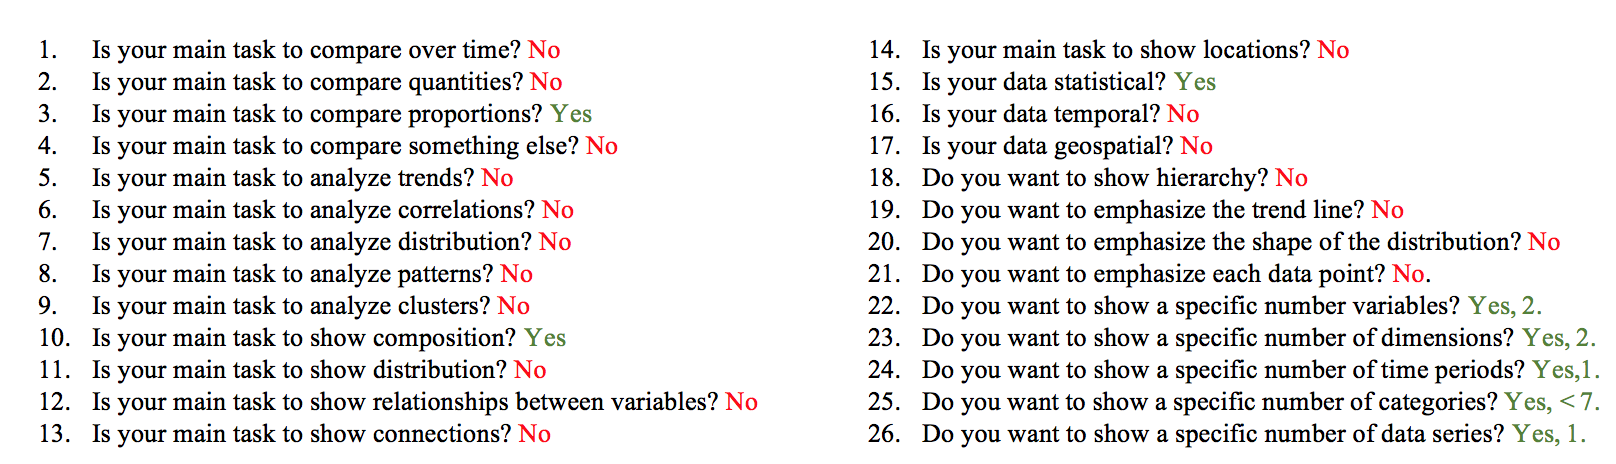
We have classified each visualization included in NEViM (see section “Visualizations List”) by answering our questions. Below you can see an example of a classification of a pie chart.