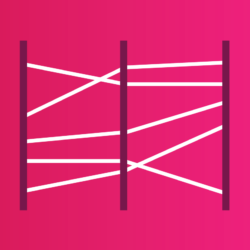
 Parallel Coordinates
 Dot Map
 Choropleth Map
 Flow Map
 Connection Map
 Proportional Symbol Map
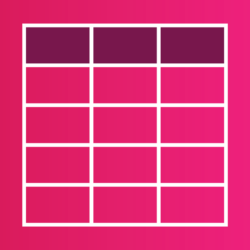 Table
Table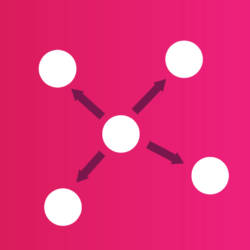 Network
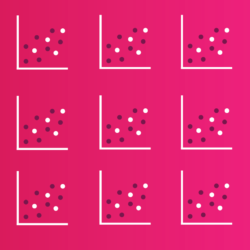 Scatter Plot Matrix
 Connected Dot Plot
 Timeline
 Heatmap
 Tree Map
 Stacked Area Chart
 Cartogram
 Slope Graph
 Scatter Plot
 Word Cloud
 Density Plot
 Histogram
 Stacked Bar Chart
 Stacked Line Chart
 Line Chart
 Radar Plot
 Pie Chart
 Clustered Bar Chart
 Bubble Chart
 Bar Chart
 Small Multiples